Customer story · Furniture

What sells where, in one dashboard.
PUUUR sells its custom furniture online, in two showrooms and through dealers, all on one platform. The sales dashboard shows what sells where.

PlatformFeaturesSales dashboard
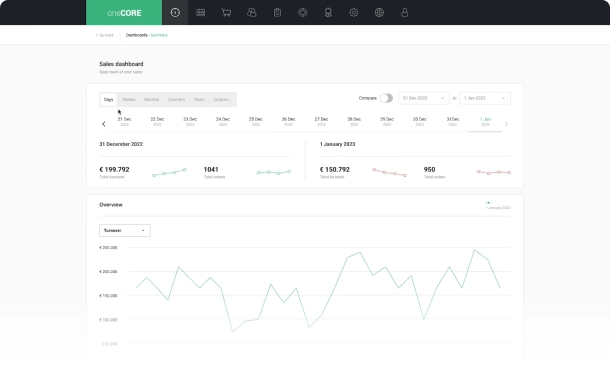
The oneCORE sales dashboard shows your most important sales data in one visual overview. Measure your results, compare them with your goals and spot new opportunities, so you decide on data.
What it does
Make data-driven decisions and sell more efficiently, from one screen.
Your sales in one clear, accurate overview. See how sales changed before and after a marketing campaign.
Put two periods side by side: days, weeks, months, quarters or years. Spot patterns and trends, learn from what you did and plan ahead.
Set your own periods. Compare one month's results with the rest of the year, and track your progress.
Real-time sales data shows how your customers behave. React quickly to what happens around you, and give your team precise feedback.
Less manual reporting. A real-time overview leaves more time for selling.

Customer story · Furniture
PUUUR sells its custom furniture online, in two showrooms and through dealers, all on one platform. The sales dashboard shows what sells where.
Related
Questions
All three: product configurator, sales portal and e-commerce. See pricing.
Days, weeks, months, quarters or years, or periods you set yourself, such as one month against the rest of the year.
Book a 30-minute demo, or try a configurator in 3D first.